Using the new EARS dashboard
Using the new EARS dashboard
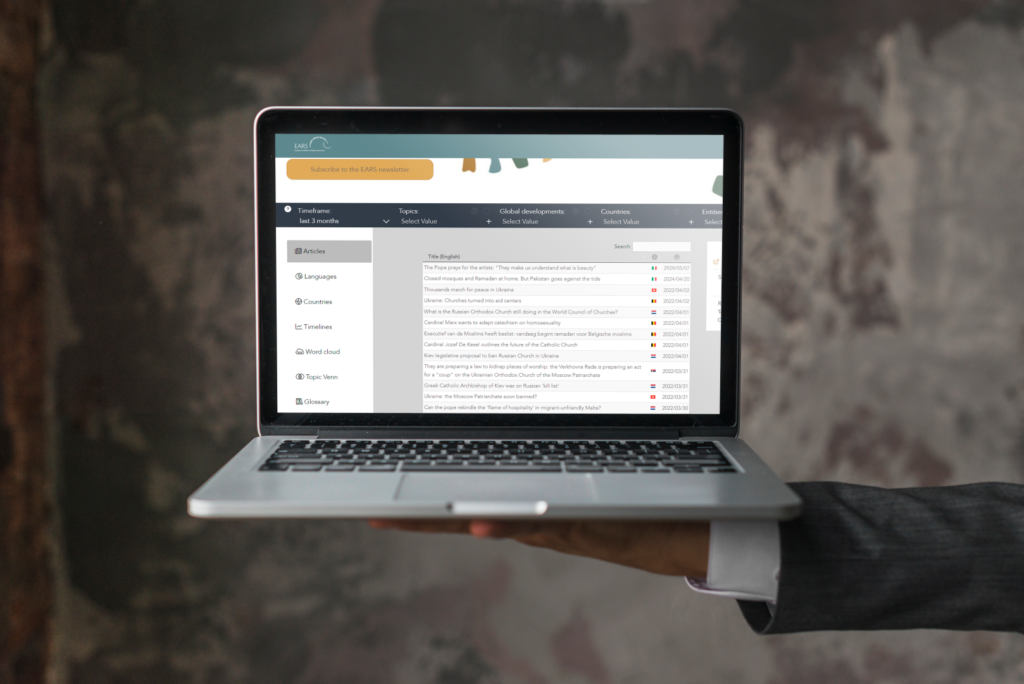
The EARS dashboard is a free tool that enables you to generate insights on religion and society based on the topics, people, countries, and timeframe of your interest. Our international team of analysts keeps the dashboard up-to-date with hundreds of new summaries each month. In this article, we will show you how you can adjust your search terms and in what way you can interpret the results on the dashboard.
Specifying your search
The dark blue bar at the top of the dashboard allows you to make your preferred selection. You do not have to make a selection for each filter, but you can do so to narrow down your search. The following filters are available:
- Timeframe: select the timeframe from which you would like to see articles. You can select a set timeframe (e.g. last week or last month), or create a custom range. This filter is set to include the last 3 months by default.
- Topics: topics are keywords that are relevant to EARS’ activities and priorities. Select one or more based on your interests.
- Global developments: global developments are objective, universal, and important around the world. They are not necessarily directly linked to religion, but rather show how religion intertwines with them. Select one or more based on your interests.
- Countries: select your countries of interest. This includes countries from where summaries were added, and countries that were addressed in summaries from other countries.
- Entities: this filter allows you to select certain people or organisations to narrow down your search.
Different filters act on an ‘AND’ basis. This means that if you select a topic and an entity, the resulting summaries will contain both that specific topic and that specific entity.
The individual filters act on an ‘OR’ basis by default. That means that if you select two topics, the resulting summaries will contain one or both of the topics. By clicking the circle icon in the specific filter, you can switch to the ‘AND’ operator. The dashboard results will then only contain the summaries that include both topics. This works the same for topics as for global developments, countries, and entities.
For example, at the time of writing, when selecting the topics leadership and tension with a timeframe of ‘last year’, 2,443 summaries are found in the dashboard. These are the summaries that include either leadership, tension, or both of these topics.
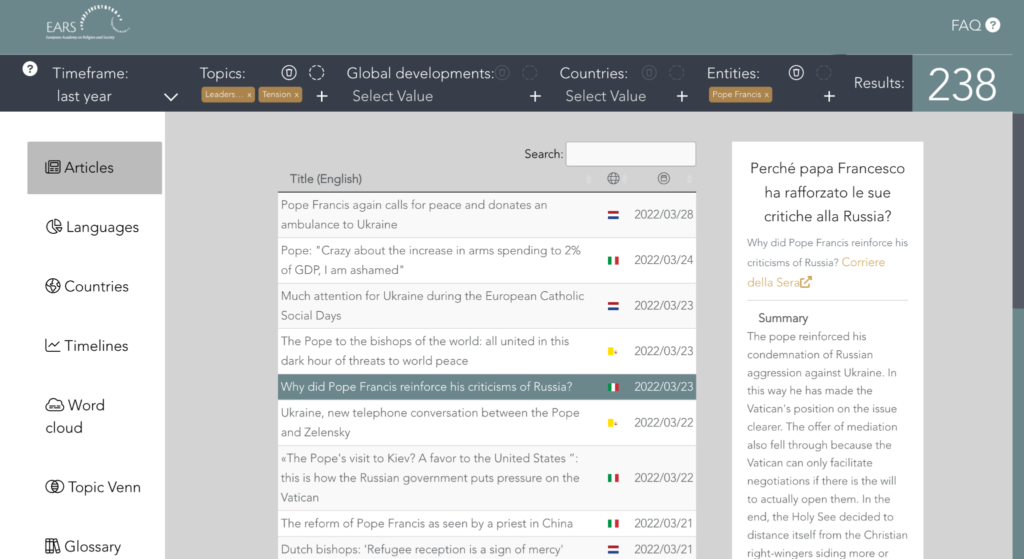
When adding Pope Francis in the entities filter, 238 summaries remain. These are the summaries that include either leadership, tension, or both of these topics, but also, in all cases, the entity Pope Francis. We will use the example of these 238 summaries to explain the dashboard’s functionalities in more detail below.
Articles
The dashboard provides a complete list of article summaries that are included in your search scope. In our example, this means that a list of all 238 articles is provided. Click on an article from the list to display its title, publication date, and a summary of the article. This summary is always in English. The referenced countries, topics, and global developments are also included in this display. If you would like to read the original article, simply click the link at the top.
Languages
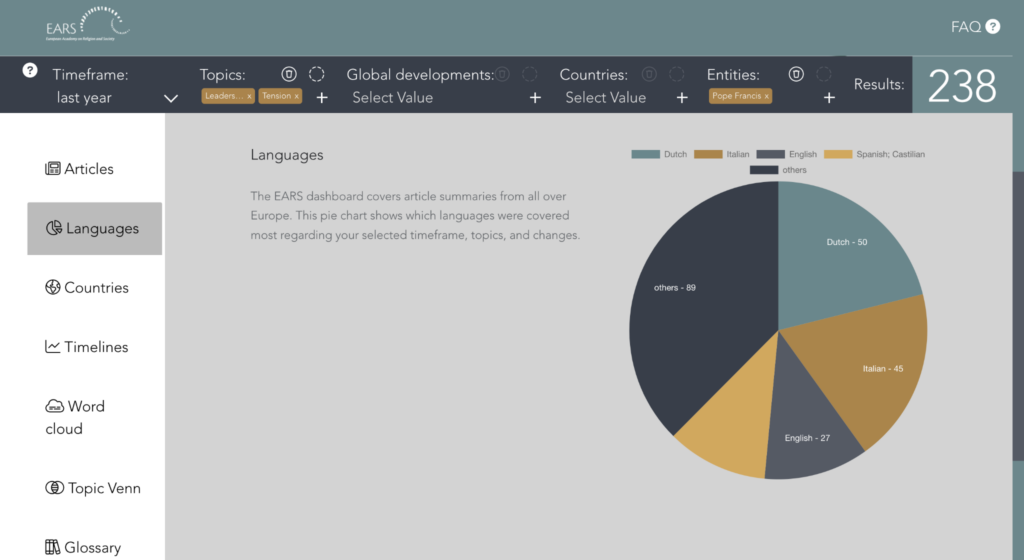
The second tab in the dashboard provides an overview of the languages covered in your selection. In the case of our selection, it can be seen that 50 of the summaries were in Dutch and 45 were in Italian, for example.
Countries
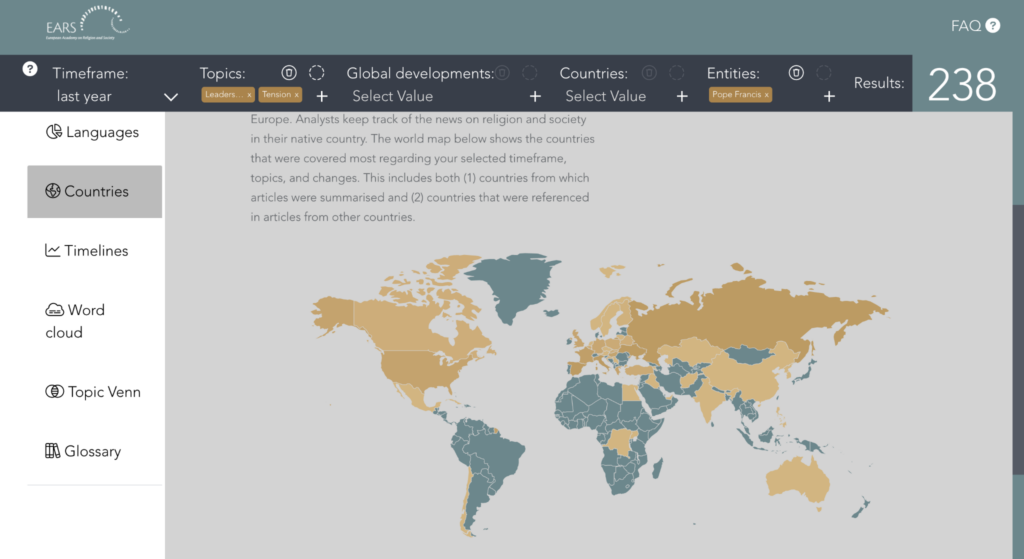
Our team of analysts keeps the dashboard up-to-date on a daily basis. They are located across Europe and keep track of the news in their own country. The world map on the dashboard shows that some issues play a more important role in one country than in the other. It signals both where an article was published and what country the article is about.
In our example, many summaries considered, or were published in, Spain (31), Italy (31), Russia (30), and Ukraine (30).
Timelines
The graphs in the section ‘timelines’ show how often a specific topic, global development, or entity is mentioned on the dashboard. Note that this is a percentage of the articles published on the dashboard, so not an exact representation of all articles in the European media.
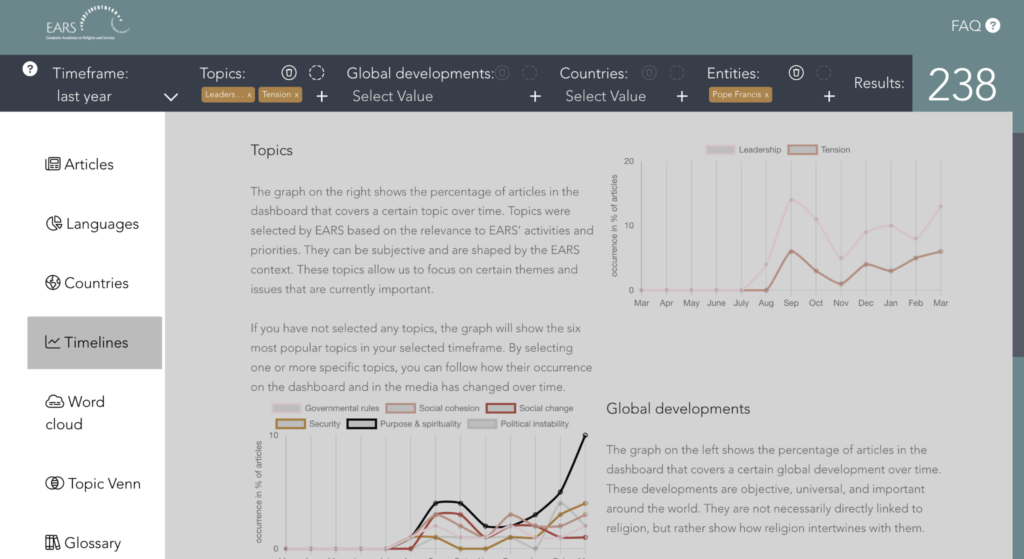
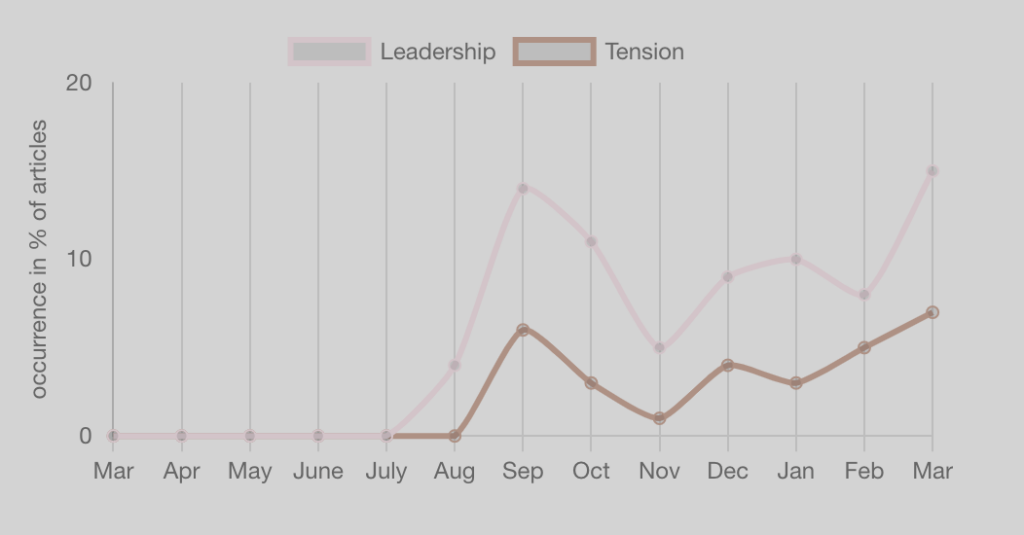
In our example, since we selected the two topics of leadership and tension, the topics graph shows just these two. We can see that both keywords have gained importance on the dashboard over time in the past months.
Since we did not select any global developments in our example, the graph shows the six most occurring developments on the dashboard.

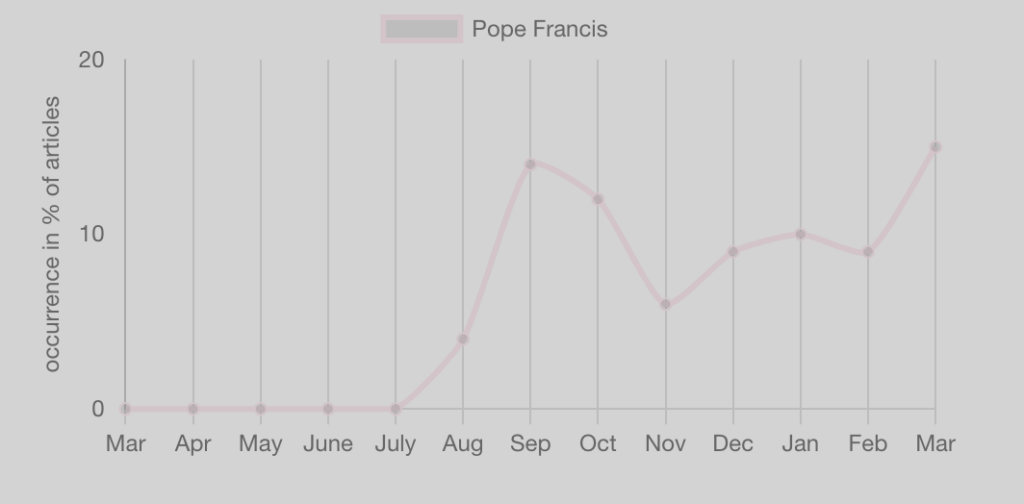
The graph for entities only shows Pope Francis, since he is the only person or organisation we included in our filter.
Word cloud
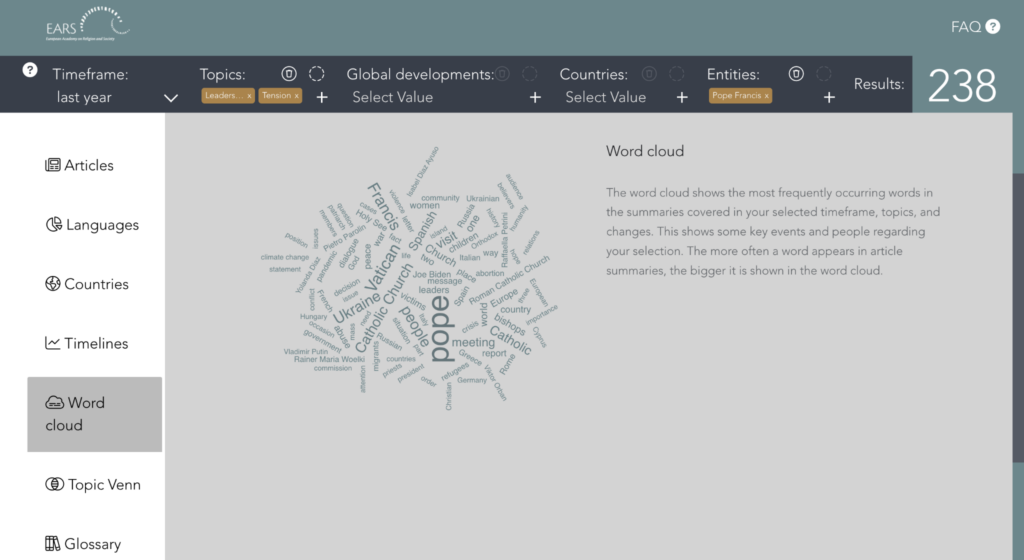
The word cloud generated on the dashboard provides an easy way to see which themes are most important within your selected scope. The more often a word appears in article summaries, the bigger it is shown in the word cloud. In our example, focusing on the keywords leadership and tension and on the entity Pope Francis, we can see that the pope himself was most frequently mentioned. In addition, topics such as Ukraine, the Catholic Church, and the Vatican often occurred in this selection of articles.
Topic Venn
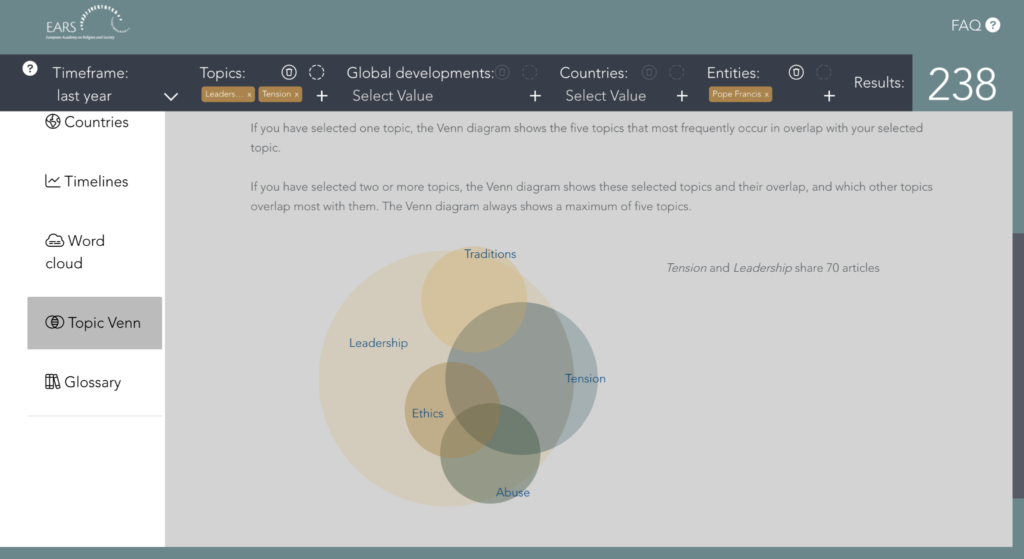
Some of our 238 articles might relate to one of our selected keywords only, whereas others may be linked to both of the topics. In the Venn diagram on the dashboard, you can see how the topics overlap. Our example shows that most articles in our selection include the keyword leadership (227 summaries). The summaries relating to tension (81 articles) highly overlap with these: 70 articles consider both the keyword leadership and tension.
The Venn diagram automatically adds additional topics that are strongly related to your selection of keywords. In this case, we can see that ethics, abuse, and traditions are most strongly connected to leadership and abuse.
Glossary
The final section of the dashboard provides a glossary of the topics and global developments that can be selected. For example, leadership is defined as ‘leading a group of people or organisation’. Our keyword tension is defined as ‘opposition between individuals or groups’.
Your turn on the EARS dashboard
The example above shows how you can use the EARS dashboard to generate new insights on the topic of religion and society. You are now all ready to use the dashboard yourself by comparing and analysing your preferred topics, global developments, entities, countries, and timeframes.
